


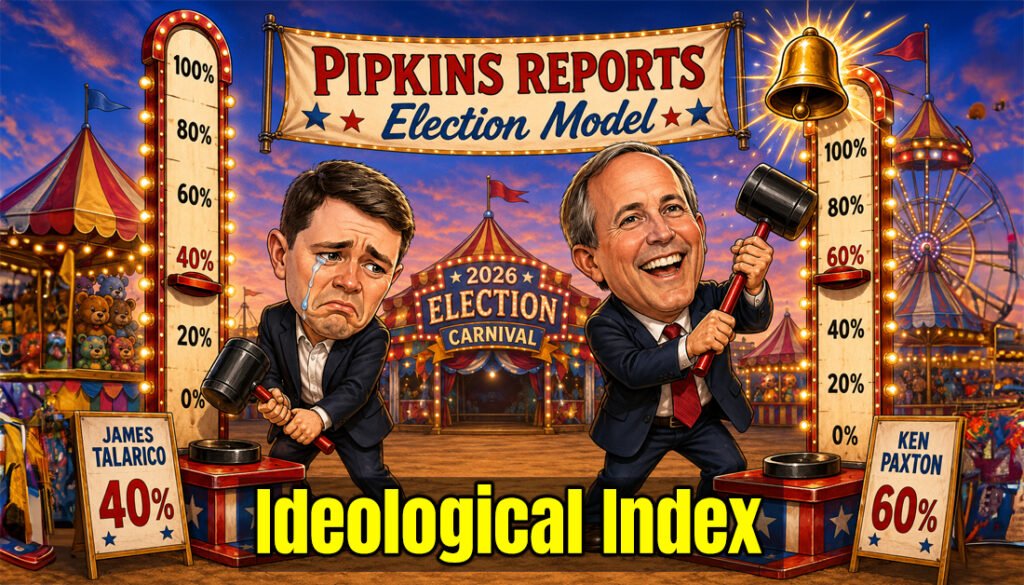
Austin, TX – If the Texas Senate election were decided by ideology, turnout, and the assumptions laid out in the Pipkins Reports election model, Ken Paxton wouldn’t just beat James Talarico, he would beat him badly.
Our model projects a 59.4% to 40.6% victory for Paxton, a Republican margin of approximately 18.8 percentage points.
We’ve been making this claim for months. Now we can explain why.
This is not a polling forecast. It isn’t based on a collection of survey respondents being asked what they might do months before an election. It is an election model, built from the ideological composition of the Texas electorate, a projected increase in turnout and a defined set of assumptions about how voters divide between the two candidates.
Those assumptions can be debated. The math can not.
The Pipkins Reports Ideological Index
To build the model, Pipkins Reports established an ideological index using 0 as the political center, with candidates moving toward -10 on the left and +10 on the right.
The scores are analytical, not official government ratings. They are based on the candidates’ public records and positions on major political questions, including taxation, government spending, abortion, guns, immigration, transgender policy, health care, education, criminal justice, energy, federalism and cultural issues.
The historical comparison looks like this:
| Year | Democratic nominee | Ideological score, Democrat | Republican nominee | Ideological score, Republican | Total ideological difference | GOP margin of victory |
|---|---|---|---|---|---|---|
| 2002 | Ron Kirk | -2.0 | John Cornyn | +5.0 | 7.0 | 11.97 pts. |
| 2008 | Rick Noriega | -3.5 | John Cornyn | +5.0 | 8.5 | 11.98 pts. |
| 2012 | Paul Sadler | -3.0 | Ted Cruz | +8.0 | 11.0 | 16.18 pts. |
| 2014 | David Alameel | -3.0 | John Cornyn | +5.0 | 8.0 | 27.20 pts. |
| 2018 | Beto O’Rourke | -6.5 | Ted Cruz | +8.0 | 14.5 | 2.56 pts. |
| 2020 | M.J. Hegar | -5.5 | John Cornyn | +5.0 | 10.5 | 9.64 pts. |
| 2024 | Colin Allred | -4.0 | Ted Cruz | +8.0 | 12.0 | 8.49 pts. |
| 2026 | James Talarico | -8.5 | Ken Paxton | +9.0 | 17.5 | TBD |
The historical margins are based on Texas election results.
The most striking number in the table may be the ideological difference in the upcoming race.
Talarico is scored at -8.5, substantially farther left than Beto O’Rourke at -6.5 and Colin Allred at -4.0.
Talarico has rejected the label “democratic socialist,” and Pipkins Reports does not assign that label to him. However, his policies nevertheless contains substantial overlap with modern progressive and social-democratic positions.
Paxton, meanwhile, is scored at +9.0, making the ideological distance between the two nominees 17.5 points, the largest gap in our historical comparison.
For context, the largest previous gap was the 2018 Cruz-O’Rourke race at 14.5 points. Cruz won that election by only 2.56 points, demonstrating that ideological distance by itself doesn’t determine an election.
What We Believe the Texas Electorate Looks Like
The model begins with an ideological breakdown of Texas voters derived from Texas Public Opinion Research‘s survey of registered voters.
TPOR found that, among the Texas electorate, approximately 43% are conservative, 34% are “moderate”, and 24% are liberal. Because those rounded numbers total 101%, Pipkins Reports normalized the figures to 100%.
Then comes the key assumption. We assign all conservative voters to Paxton and all liberal voters to Talarico. The moderate electorate is divided exactly 50/50.
That produces a theoretical statewide vote of: Paxton: 59.406%, Talarico: 40.594%
The model isn’t claiming that every conservative Texan will vote for Paxton or every liberal Texan will vote for Talarico. Those are simplifying assumptions designed to create a baseline model. And there is another assumption.
Five Percent More Voters
Texas recorded approximately 8.1 million voters in the 2022 midterm election. For purposes of this model, we assume 2026 turnout increases by 5%.
That produces approximately 8.51 million voters.
We then assume the additional voters have the same ideological distribution as the existing electorate and that the new moderate voters also split 50/50.
Under those conditions, the model produces:
| Candidate | Projected vote | Projected votes |
| Ken Paxton | 59.41% | 5.05 million |
| James Talarico | 40.59% | 3.45 million |
| Margin | 18.81 pts. | 1.60 million votes |
Again, this is an election model, not a polling forecast.
We’re not claiming to know what 500 or 1,000 randomly selected Texans say they intend to do. We’re asking what happens if the electorate actually looks like the ideological distribution we’ve established and behaves according to the assumptions we’ve specified.
Under those conditions, Paxton wins by approximately 18.8 percentage points.
OPINION: Here’s Why I Think This Matters
I’ve spent enough time watching Texas politics to know that campaign consultants love a good poll. They love it even more when the poll tells them exactly what they want to hear.
But elections aren’t conducted by polling firms, they’re conducted by actual voters.
And voters don’t walk into a polling place carrying a survey questionnaire. They walk in carrying years of accumulated opinions about government, taxes, crime, immigration, schools, guns, abortion, religion and the direction of the country.
That is why I find the ideological comparison more interesting than the latest political horse race narrative.
Talarico isn’t simply another Texas Democrat.
By our methodology, he is farther left than O’Rourke and considerably farther left than Allred. Paxton, meanwhile, is the polar opposite and is positioned well to the right of the political center.
That creates a 17.5-point ideological canyon between the two candidates.
Could Talarico cross it? Maybe…but unlikely.
Texas voters have surprised political professionals before. Beto O’Rourke came within 2.56 points of defeating Ted Cruz in 2018 despite a very large ideological gap. Candidate quality, campaign organization, money, national political conditions and the personalities of the nominees can overwhelm simple ideological arithmetic.
I believe that the electorate will remain roughly as conservative as the available ideological data suggests, and if the moderates really do split evenly, Talarico has a very steep hill to climb.
Our model says Paxton wins 59.4% to 40.6%.
That’s an 18.8-point victory…. for the sake of conservatism (small “c”) I am only predicting a margin of 10 points. You heard it here first, folks.